Performance & Load Benchmark > Headless CMS
Write Operation Benchmark
Webiny Headless CMS performance write benchmark.
- performance of write operations on Webiny Headless CMS
- optimization suggestions
Note that these benchmarks were performed when Webiny was using Amazon Elasticsearch Service as its search engine of choice. And although with the 5.39.0 release Webiny started using Amazon OpenSearch Service, this article is still relevant as the performance of the two services is very similar.
Results
 image
image| Test | Records inserted | Avg. response time (ms) | p95 response time (ms) | Throughput (req/sec) |
|---|---|---|---|---|
| Test A | 77,197 | 408.05 | 619.95 | 116.88 |
| Test B | 759,679 | 414.64 | 662.00 | 1,149.83 |
| Test C | 1,506,112 | 418.21 | 656.00 | 2,279.87 |
| Test D | 3,319,812 | 432.45 | 652.00 | 3,949.16 |
| Test E | 3,343,666 | 429.27 | 661.00 | 3,977.34 |
What Does This Mean?
Requests per second is a number that helps you calculate how many users you can actually serve. The other part of that calculation is to know how your users behave. How many calls to the read API they are doing in a set time period.
As an example say your average visitors stays on your site 5 minutes, and does around 10 calls to the write API. Based on the throughput (req/sec) and this user behavior you can exact the following estimated values for how many concurrent users you can serve within that period:
| Test | Throughput (req/sec) | Concurrency |
|---|---|---|
| Test A | 116.88 | 3,506 |
| Test B | 1,149.83 | 34,495 |
| Test C | 2,279.87 | 68,396 |
| Test D | 3,949.16 | 118,474 |
| Test E | 3,977.34 | 119,320 |
Formula: (Throughput*60sec*5min)/10 calls per user = total number of concurrent users in a 5 minute period.
Note: This is the formula for ideal conditions where user requests have an ideal spread of time between requests.
Benchmark Overview
In this benchmark we are doing a GraphQL mutation request to the Headless CMS manage API. The mutation is inserting a new “Order” record and upon successful save, returning back the id of the new record.
Here is the full mutation that is being issued:
The variables are replaced with real values during the test by Apache JMeter.
You can view the full content model structure and relations between different models on this link here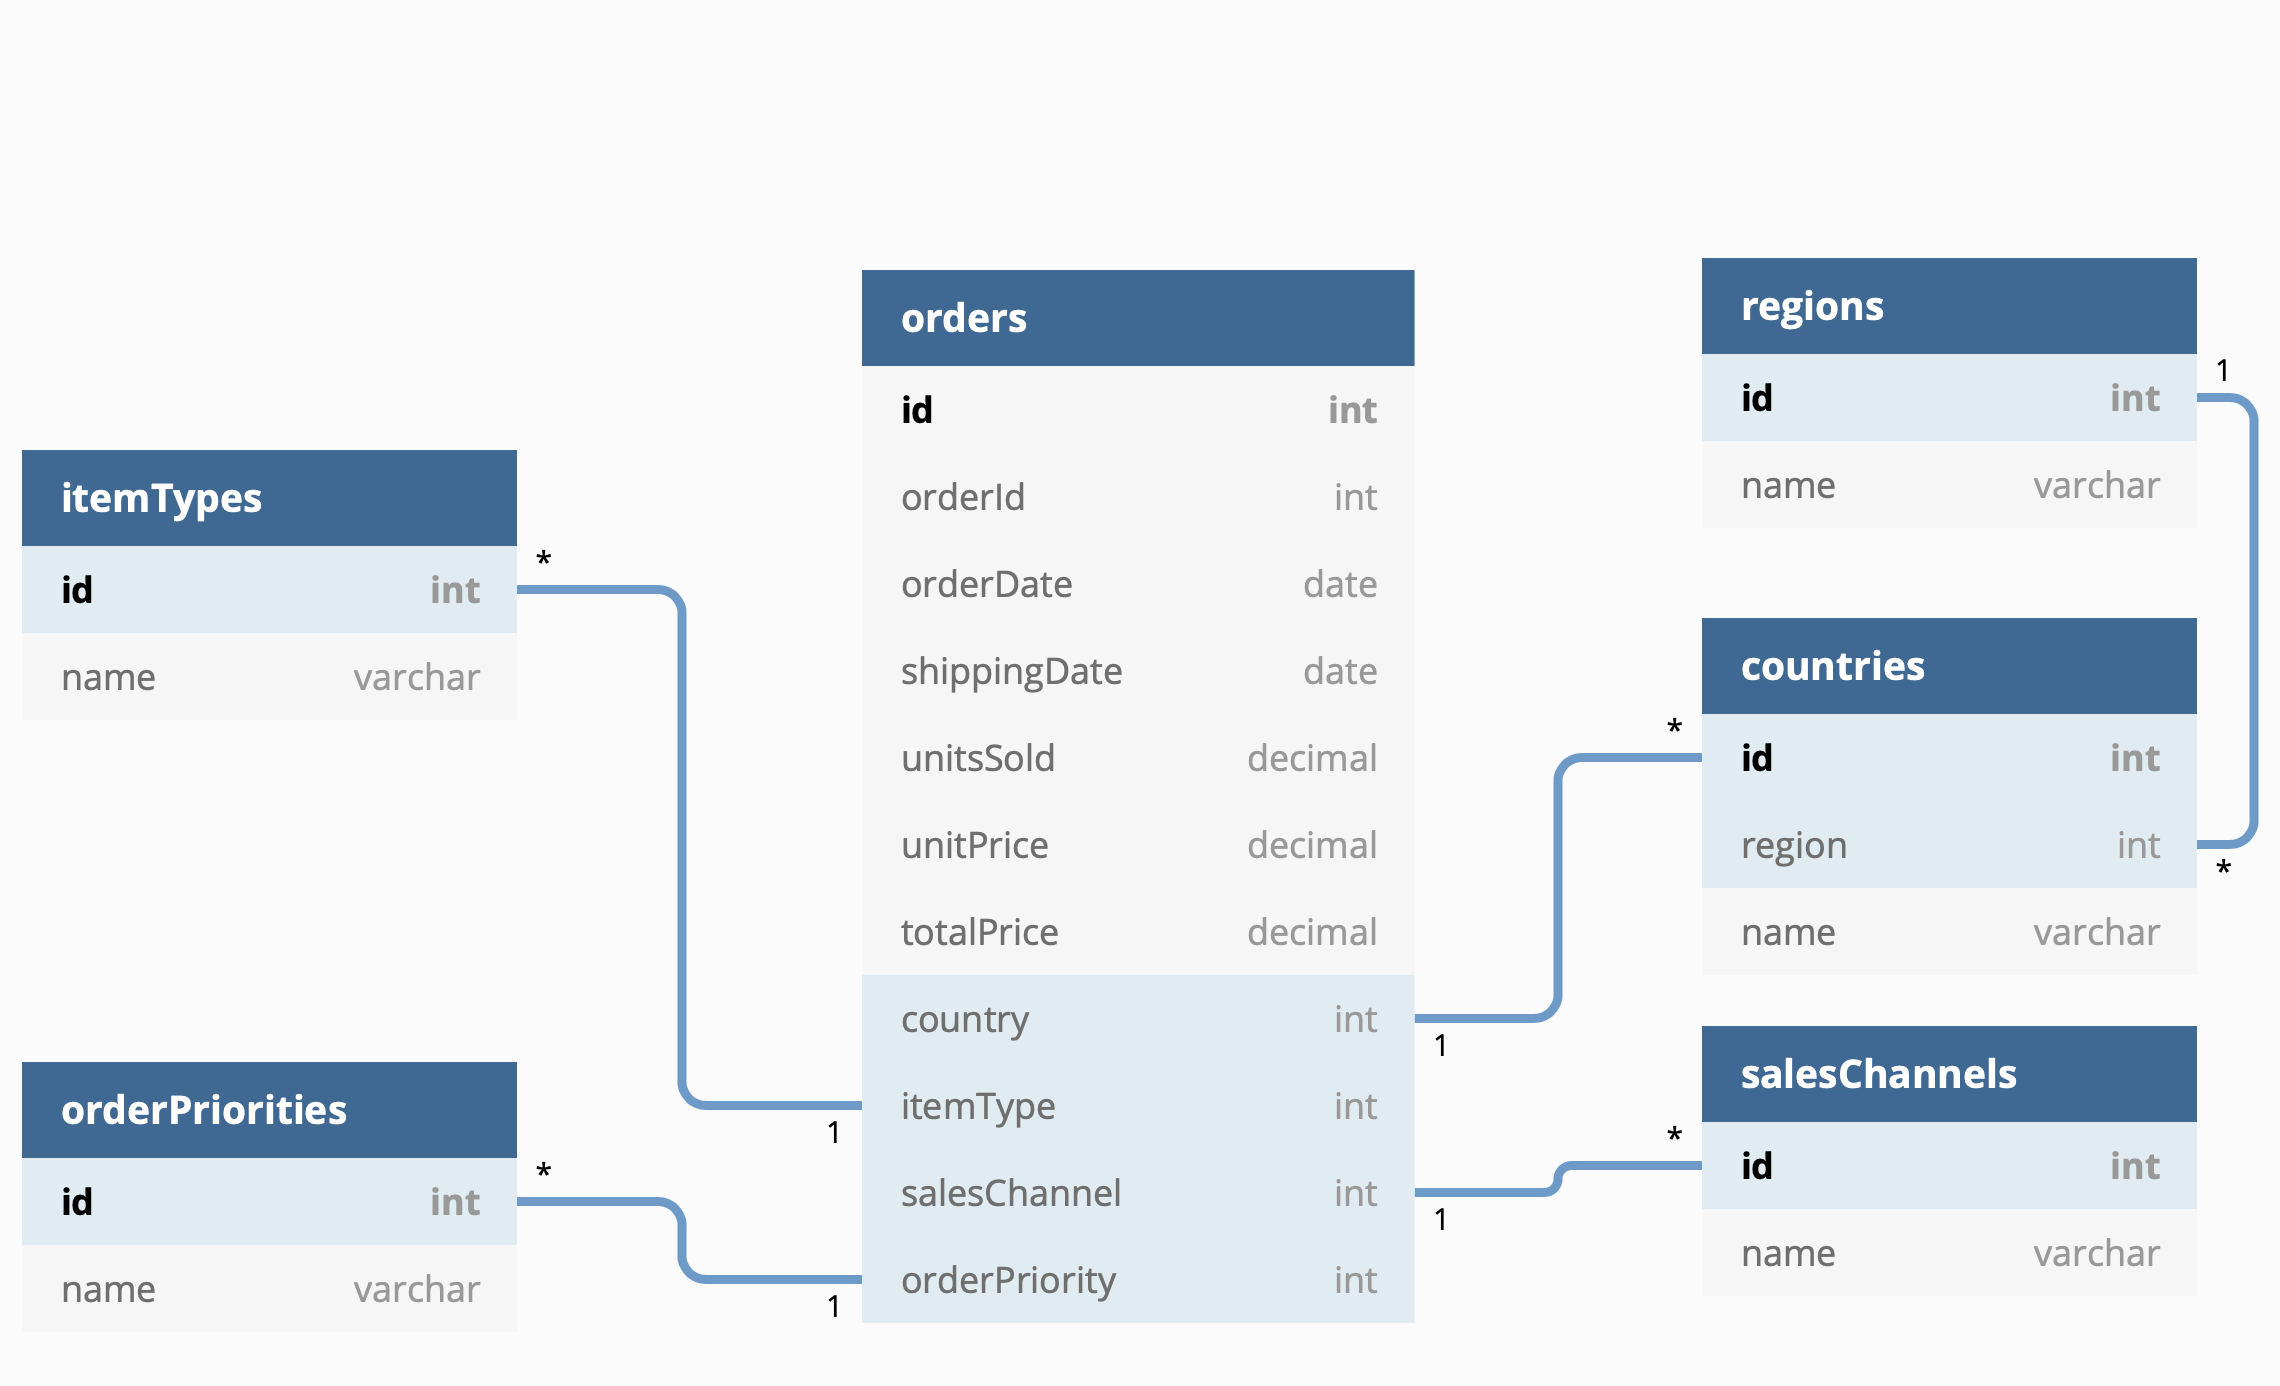 .
.
Test Plan
We performed 5 variations of this test. The reason is that Webiny uses Elasticsearch, which is the only non-serverless infrastructure piece that’s part of the architecture. Being non-serverless means we need to manually scale it. So we decided to run 5 different test variations. In each of variations we changed the load amount and the instance type.
| Test | Number of users | Ramp up time | Instance | Price per hour |
|---|---|---|---|---|
| Test A | 50 | 60 sec | t3.small.elasticsearch (single AZ) | 1x $0.038 |
| Test B | 500 | 60 sec | m5.large.elasticsearch (2 zones) | 2x $0.164 |
| Test C | 1000 | 60 sec | m5.3xlarge.elasticsearch (2 zones) | 2x $0.655 |
| Test D | 2000 | 5 min | r4.4xlarge.elasticsearch (2 zones) | 2x $1.841 |
| Test E | 2000 | 5 min | c5.18xlarge.elasticsearch (2 zones) | 2x $5.363 |
Load Structure
The test is configured by ramping up to the defined number of user threads within the defined period. After the ramp up we keep a steady state where the maximum amount of user threads are doing requests as fast as the system can handle for a period of 10 minutes. The reason the ramp up time differs between the first 3 tests and the last 2 is that eu-west-2 region as a burst limit of 500 concurrent lambda executions per 1 minute. Meaning to achieve 2500 user in the stead state, we need to ramp up for 5 minutes. For more details on how the burst limit works, visit this AWS resource page .
.
Also, for test D and E, we had to increase the lambda concurrency to 2500 by filing an AWS support ticket. Webiny can go above that number, but for that the AWS team needs to additionally raise the concurrency limit. Finally to mention, the Elasticsearch instance in test D and E can take higher load than what our current lambda concurrency allowed for. (applies only to the write API)
Request Flow
Each write request has the following flow:
Client -> CloudFront -> ApiGateway -> Lambda -> DynamoDB -> (async stream) -> Lambda -> Elasticsearch
Webiny writes in Elasticsearch via a DynamoDB stream, which is an asynchronous process. We do this as Elasticsearch can be a performance bottleneck and with this approach we prevent it from lowering the overall throughput.
Although Elasticsearch is not part of the main request, the service can still be overwhelmed if there is a lot of data that needs to be synced from DynamoDB into Elasticsearch in a short period of time.
The stream details, such as batchSize and maximumBatchingWindowInSeconds can be adjusted inside api/pulumi/elasticSearch.ts.
For additional info, check out the official AWS guide.
Additional thing to mention is that every write request has 1 DynamoDB write in general as we tend to do bulk writes, but there is also at least 1 read operation that happens as well. That read operation is issued by the Webiny security module to verify if the current user, or token, has the right to perform this action.
Report
We only extracted the charts for the last 2 tests as most charts showed the same behavior. In case you want to see the full report with all the charts for all the tests, click here.
Response Times
Test D
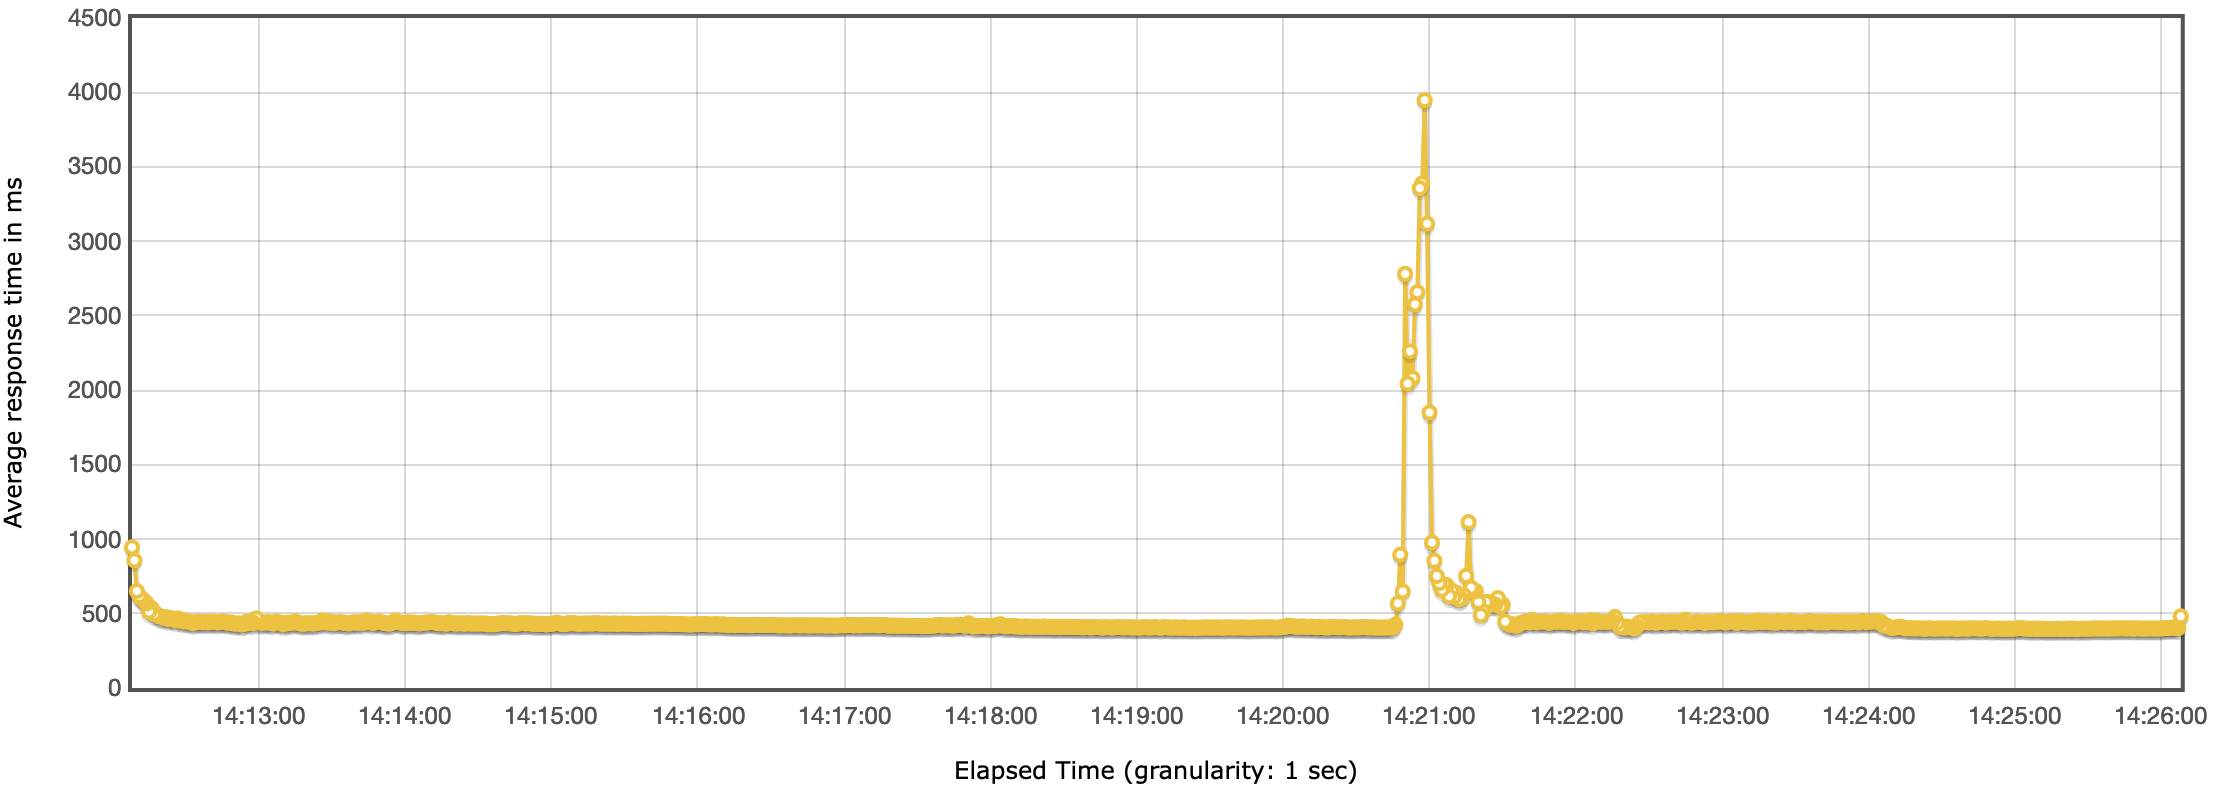 Headless CMS benchmark - Response time
The response time was mostly consistent, with the exception around the 14:21 mark. At that point the response times spiked for a few seconds but then leveled off to the previous performance and stayed stable for next 5 minutes, until the end of the test.
Test E
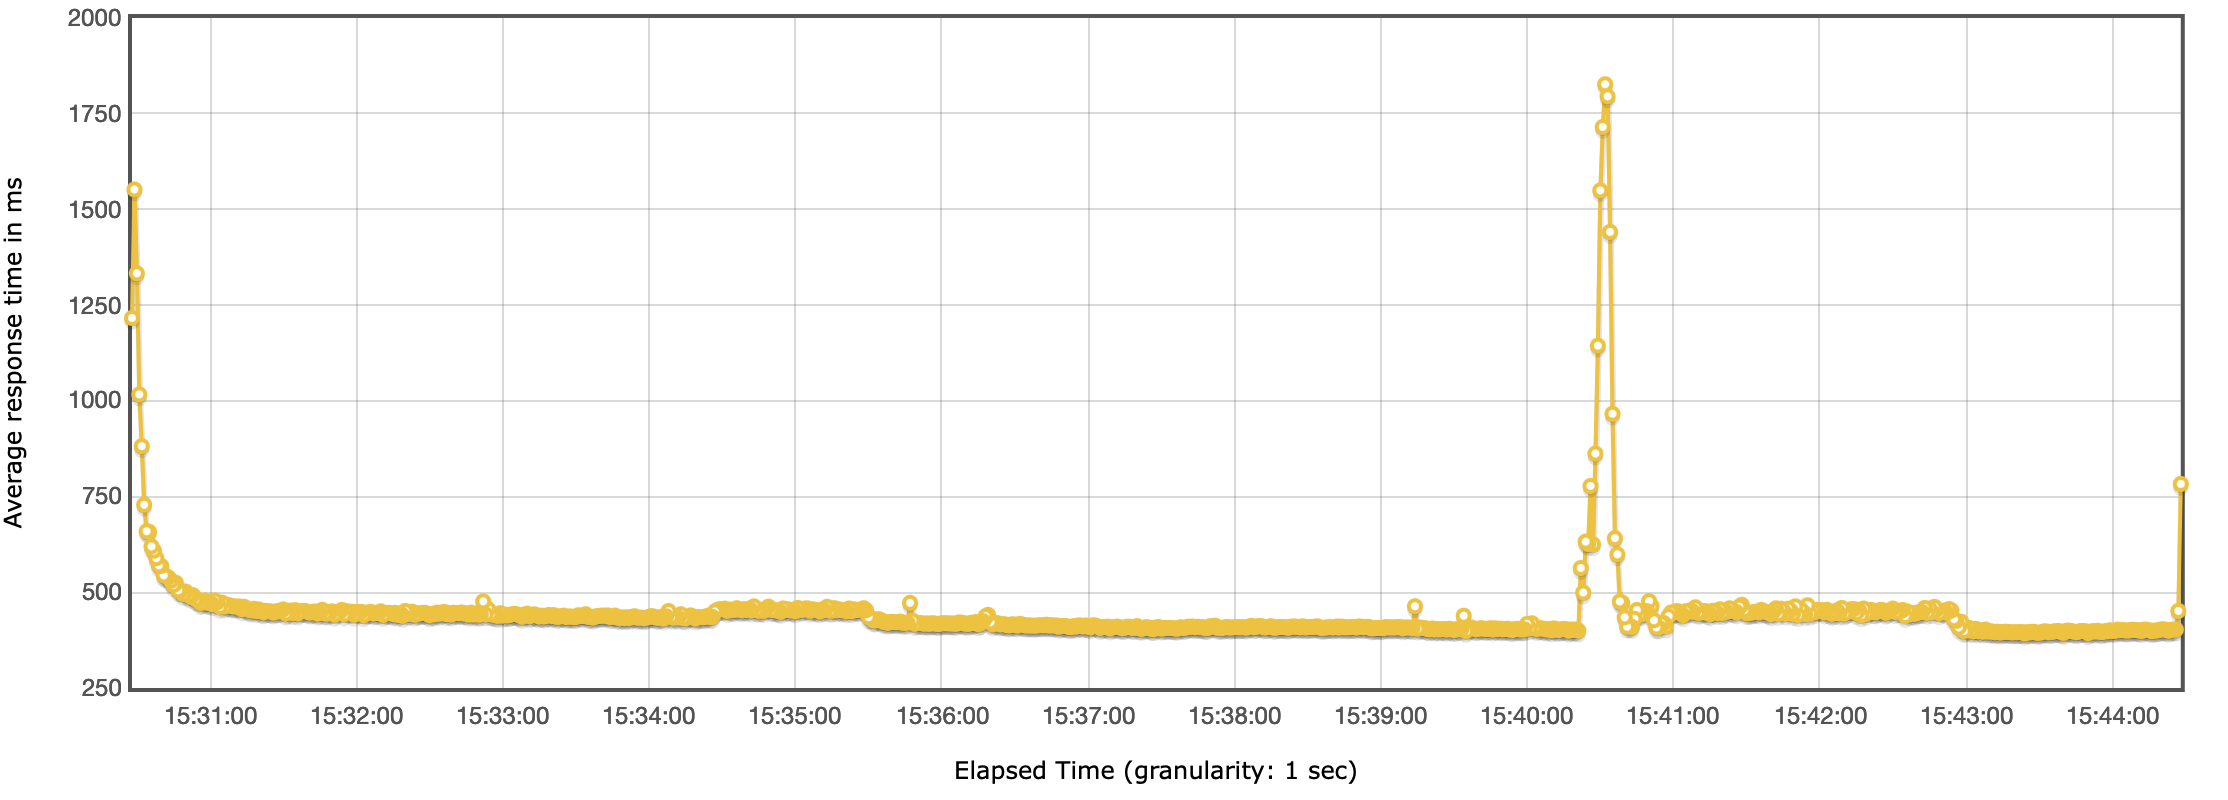 Headless CMS benchmark - Response time
Throughput
Test D
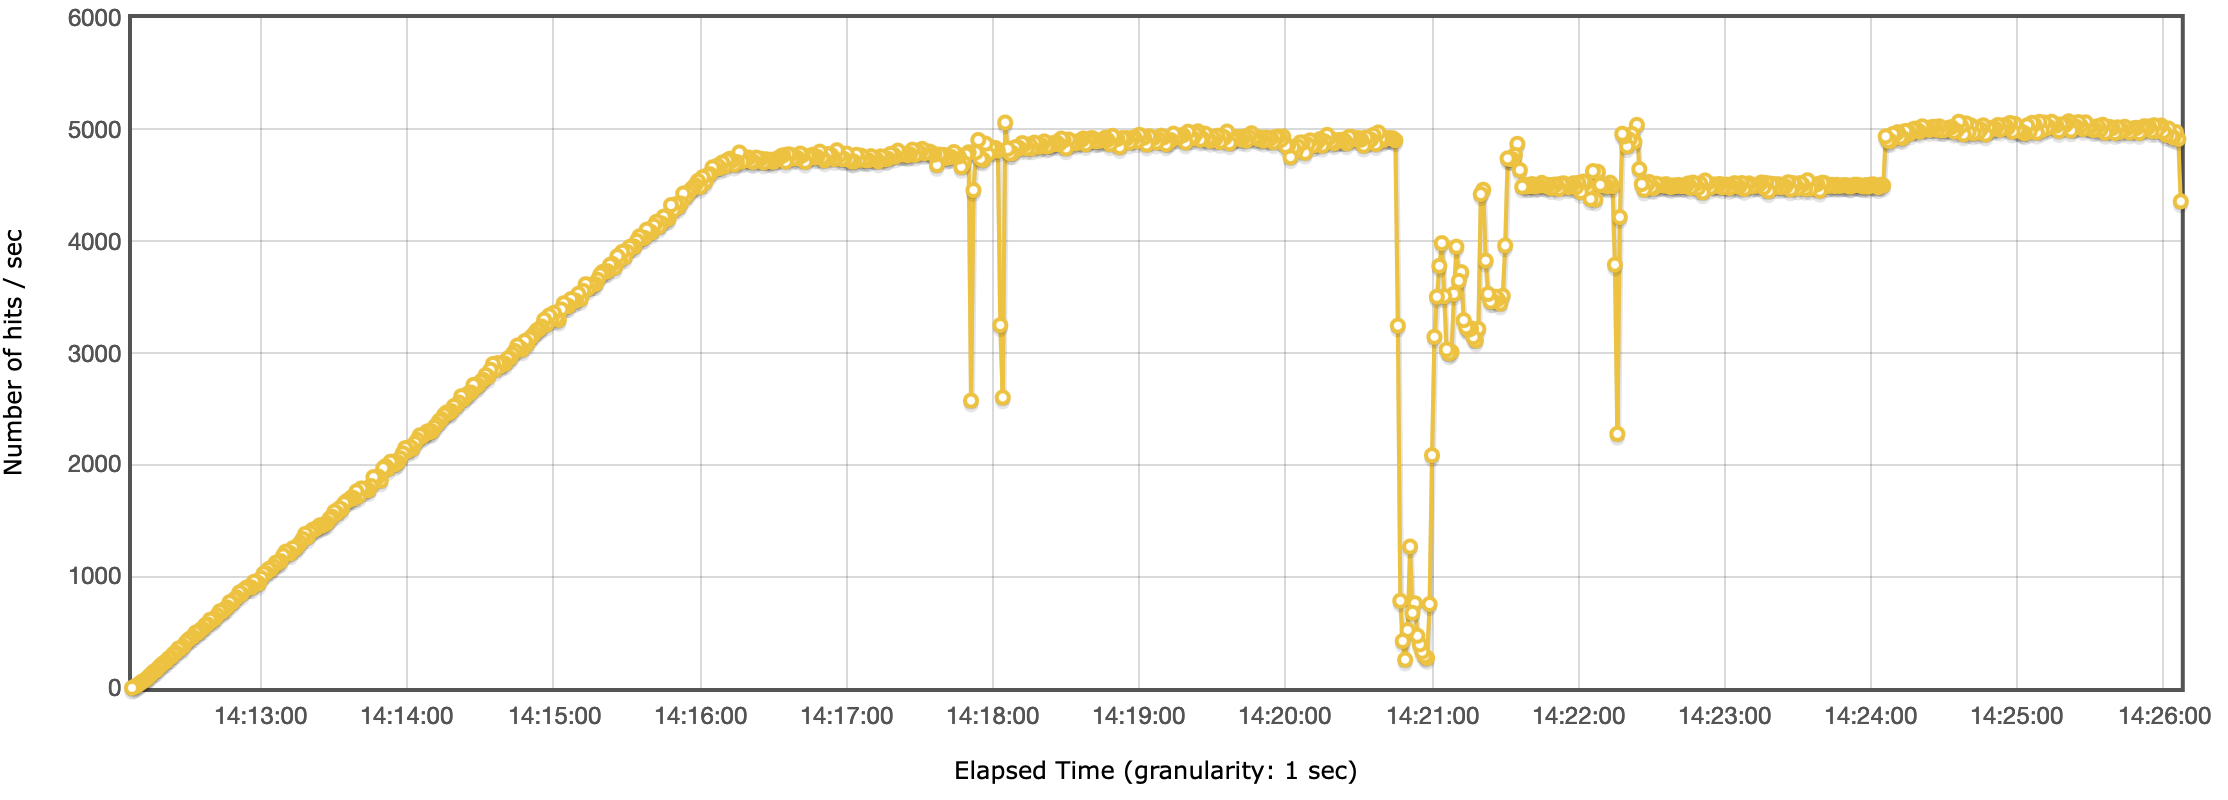 Headless CMS benchmark - Throughput
Test E
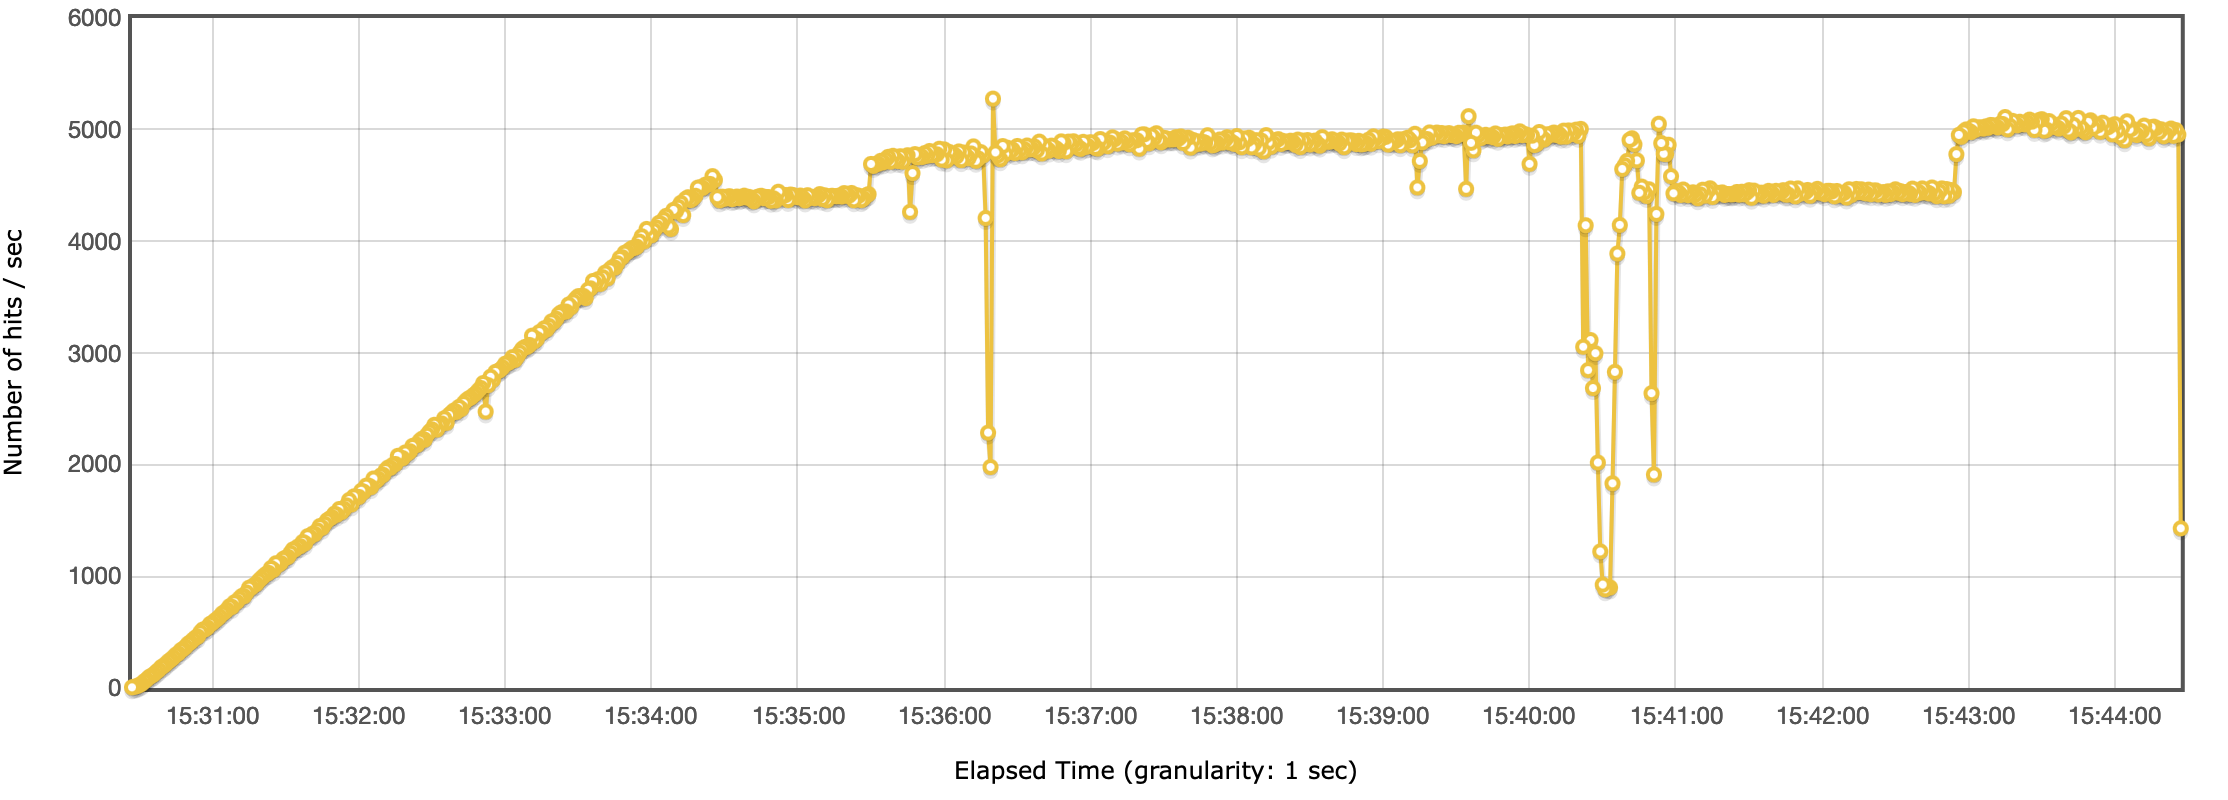 Headless CMS benchmark - Throughput
In line to what we see in the response times, we see a drop in the throughput around the same time.
After investigating the CloudWatch metrics, we couldn’t find anything that would point to the fact that the drop in performance was to the AWS services. The response times on the CloudFront, API Gateway and Lambda functions haven’t changed. The only explanation we have is that it was a limit we hit either on the network or CPU on the load test machine.
Optimization Suggestions
There are 3 key components that control your throughput and cost.
1. DynamoDB
By default DynamoDB is configured with on demand capacity. To lower your cost, once you have a good sense of your access patterns, we recommend you switch to provisioned capacity mode. This mode will be cheaper to use if configured correctly.
2. Lambda concurrency
By default your AWS account will have a soft limit of 1000 lambda concurrent executions. We recommend you increase this limit by filing a support request with AWS.
It’s also important to be aware of the burst capacity limits, for more info visit this AWS resource page.
3. Elasticsearch service
This is the only service which is not fully serverless and needs to be manually scaled. The above numbers should help you determine how to size accordingly.
Additionally, adjusting the batchSize and maximumBatchingWindowInSeconds can also help, but this is determined by your access patterns.
Cost
Total Cost
| Test | CloudFront | ApiGateway | Lambda | DynamoDB | Elasticsearch | Total |
|---|---|---|---|---|---|---|
| Test A | $0.08 | $0.08 | $0.26 | $0.58 | $0.01 | $1.01 |
| Test B | $0.83 | $0.76 | $2.58 | $3.48 | $0.08 | $7.73 |
| Test C | $1.65 | $1.51 | $5.20 | $6.56 | $0.33 | $15.25 |
| Test D | $3.64 | $3.32 | $11.79 | $14.85 | $0.92 | $34.52 |
| Test E | $3.75 | $3.34 | $11.78 | $13.24 | $2.68 | $34.79 |
The cost of serverless components has been calculated based on their usage. The cost of Elasticsearch has been calculated for a 15min period, based on the hourly rate.
Cost per 10k Requests
 image
image| Test | Hits | Total cost | Cost per 10k requests |
|---|---|---|---|
| Test A | 77,197 | $1.01 | $0.13083 |
| Test B | 759,679 | $7.73 | $0.10175 |
| Test C | 1,506,112 | $15.25 | $0.10125 |
| Test D | 3,319,812 | $34.52 | $0.10398 |
| Test E | 3,343,666 | $34.79 | $0.10405 |
CloudFront
| Test | Hits | Traffic (GB) | Cost |
|---|---|---|---|
| Test A | 77.3k | 0.09 | $0.08 |
| Test B | 760k | 0.85 | $0.83 |
| Test C | 1.51M | 1.69 | $1.65 |
| Test D | 3.32M | 3.70 | $3.64 |
| Test E | 3.34M | 3.75 | $3.66 |
API Gateway
| Test | Hits | Cost |
|---|---|---|
| Test A | 77.3k | $0.08 |
| Test B | 760k | $0.76 |
| Test C | 1.51M | $1.51 |
| Test C | 3.32M | $3.32 |
| Test C | 3.34M | $3.34 |
Lambda
| Test | Requests | Avg. Duration (ms) | Cost |
|---|---|---|---|
| Test A | 80.2k | 371 | $0.26 |
| Test B | 762k | 382 | $2.58 |
| Test C | 1.51M | 389 | $5.20 |
| Test D | 3.32M | 402 | $11.79 |
| Test E | 3.34M | 399 | $11.78 |
Lambda costs also include the cost that’s occurred by the DynamoDB stream. Webiny uses Lambda functions with 512MB of memory.
Notice how test E is cheaper by 1 cent from test D, it’s only 3ms difference in the execution time.
DynamoDB
| Test | Read ops | Write ops | Cost |
|---|---|---|---|
| Test A | 163k | 232k | $0.58 |
| Test B | 1.52M | 2.28M | $3.48 |
| Test C | 3.39M | 4.37M | $6.56 |
| Test D | 9.28M | 9.82M | $14.85 |
| Test E | 7.44M | 8.90M | $13.24 |
Notice how test E is cheaper than test D. This is because we were able to fit a bit more records inside the DynamoDB batch window so the stream had less operations to execute.
You can download and check the full report here: https://github.com/webiny/benchmark/tree/main/benchmarks/results/hc-write-data